One of the major criticisms of Dr. Ancel Keys is that he intentionally left out data from other countries that would have destroyed the strength of his main observation that CHD was correlated with cholesterol concentrations across the seven countries. This criticism is just nonsense. A later study of 40 countries completely supported Dr. Keys’ observations in the Seven Countries Study and I will address this below. If you read the comments of the investigators who were associated with the Seven Countriesstudy, there is no indication that subsets of data were eliminated from the study.

At the time of Dr. Keys’ 100th birthday. Prof. Mario Mancini of the Universitfldi Napoli, Napoli, Italy, wrote of his early association with Dr. Keys and how the results from the Seven Countries study were important in the establishment of a high blood cholesterol as a risk factor for CHD.

M. Mancini and J. Stamler; Diet for preventing cardiovascular diseases: Light from Ancel Keys, Distinguished Centenarian Scientist.  Nutr Metab Cardiovasc Dis (2004) 14:52-57

http://ac.els-cdn.com/S0939475304800474/1-s2.0-S0939475304800474-main.pdf?_tid=aab3f612dc4f-11e3a4ed-00000aacb361&acdnat=1400172227_f300e836483b42ff869181b38c256a26

Prof. Mancini described how, in 1954, Dr. Keys organized a meeting in Naples, Italy to discuss with leading investigators a study that would investigate the role of diet and life style on the incidence of CHD in middle aged males across a spectrum of countries. The countries to be enrolled included Finland, Greece, Italy, Japan, The Netherlands, U.S. and Yugoslavia.

If you read the early chapters in Seven Countries, Dr. Keys explained how the different groups of men were chosen and described the methods that were used to study them. The cohorts selected were men, 40 to 59 years old, usually from a well defined area where all men in that area were asked to participate in the study. The response rate for most of the groups asked to participate was over 90%, which is an excellent rate. Although seven countries were involved, more than one area was studied in most of the countries, so the total number of cohorts numbered sixteen, of which eleven were from rural regions. The particular countries used in the study were chosen because a group of researchers was available to participate in the country and the countries represented a wide range of dietary intakes. The areas within each were chosen because they represented defined areas with an apparently stable population of men. The group of men recruited in the US were comprised of railroad workers, both office workers and more active switchman, from the area outlined by Green Bay, Wisconsin; St. Louis, San Francisco, and Seattle. To make a direct comparison with the American cohort, a similar group of railroad workers was identified and recruited in Italy. One has to remember that the study was started in the 1950s, before the advent of personal computers, excel spreadsheets, the internet, and commercial jet aircraft.

The results of the Seven Countries study were described in Part I of this book. The purpose of reviewing how the study was started is to show, for that time period, that this was a brilliant, out of the box study that was conceived by a curious scientist who wished to find an answer to a serious problem.

In order to counter the argument that Dr. Keys gerrymandered the results by leaving out data from other countries, I would like to discuss a later study that was comprised of data from forty countries.

S M Artaud-Wild, S L Connor, G Sexton and W E Connor;  Differences in coronary mortality can be explained by differences in cholesterol and saturated fat intakes in 40 countries but not in France and Finland. A paradox.  Circulation. 1993;88:2771-2779

http://circ.ahajournals.org/content/88/6/2771.long

The authors of this study (referred to as the Connor study) investigated health statistics and food intake (40 dietary variables) data from forty countries that spanned many levels of socioeconomic status. The authors also used a simple Cholesterol-Saturated Fat Index (CSI) that allowed for comparisons against the combined intakes of cholesterol and saturated fat. When the data were analyzed, CHD mortality was highly correlated with the CSI across all of the countries, except for France and Finland. This correlation is shown in the figure presented below.

Correlation with CSI in Connor 1993

Although all of the data were derived from national health statistics, the large range of data accumulated allows a strong level of confidence concerning the results. The figure shows that deaths from CHD were highly correlated with the intake of saturated fat and cholesterol over 38 countries. France was off the correlation curve due to the fact that there was much less CHD for a high CSI, and Finland was off the curve because there was much more CHD for a high CSI value than expected. The authors noted these abnormalities and called them a paradox. They analyzed the dietary data for these two countries and found that Finns consumed much more milk and butterfat (fat from milk, cream, cheese, and butter) than the French. On the other hand, the French consumed more vegetables and vegetable oils than the Finns. Interestingly, the Connor study pointed to milk fat as a potent pro-CHD factor. On the whole the results of this study completely replicated the results obtained by Dr. Keys and his colleagues in the Seven Countries study.

The Connor study even observed a similar paradox as was observed by Keys. In the Seven Countries study there was a large disparity between Finland and Crete, which had widely different rates of CHD at similar fat intakes. In the Connor study, there was a large disparity between Finland and France, which had widely different rates of CHD at similar fat intakes. Of course, these disparities were probably due to the protective effects of the Mediterranean diet in Crete and France. Overall, the Connor study closely replicated the results of the the Seven Countries study but did so using data from forty countries. This study blows apart the common criticism of the Seven Countries Study that Ancel Keys did not include data from other countries and thus he altered the results concerning the roles of cholesterol and saturated fat in the development of CHD. Furthermore, we must ask the question, why would Ancel Keys alter the results? The Connor study, and many others that followed, have definitely supported the results obtained in the Seven Countries study, and my final conclusion must be that Dr. Ancel Keys was an accurate and truthful scientist.

Ancel Keys Book Cover 5-2014

If you Google Ancel Keys today you will see a group of websites that vilify Ancel Keys and call him the main starting source for the “Cholesterol Myth.” The “Cholesterol Myth” is the term used for the idea that all of the research that focused on dietary cholesterol and fat as the causative factors for Coronary Heart Disease was incorrect and, in fact, the whole concept is a conspiracy to make the American people eat a certain way. One question that immediately comes to mind is, if the “Cholesterol Myth” is part of a grand conspiracy, what were the reasons for starting it, and what benefits would there be for scientific researchers, food companies, and the US government to continue to perpetuate this conspiracy?

Anyone with a basic scientific background can read “The Seven Countries Study” book and understand that Dr. Keys presented a balanced picture of the research and was, in fact, open minded about the biology behind the observations he and his colleagues made and the data they accumulated. In no waywasDr. Keys dogmatic in his descriptions or in his conclusions.

Furthermore, at the time of the “The Seven Countries Study,” only a very small part of basic cholesterol and lipoprotein metabolism in the body was understood.

If you look through the websites that mock Dr. Keys and his basic findings, it is obvious that each uses similar catch phases, and there is little comprehensive knowledge of the sciences of nutrition and medicine presented in their criticisms.

Let’s go back and review Dr. Ancel Key’s career and contributions to science and health. Dr. Keys attended the University of California where he earned a BA in economics, a MA in zoology, and a Ph.D. in oceanography and biology. With these degrees he worked at the Mayo Clinic for two years and then he became a professor of physiology at the University of Minnesota in 1939. During World War II he worked to develop small, easily transportable packets of food that later were called K-rations. He also began a study of the physiological changes that occur in humans during starvation. The participants in the study were 36 male conscientious objectors. The point of this study was to understand the basic physiological mechanisms that were in play during starvation, and what was the best way to treat a starving person from a medical and nutritional perspective. This information later was invaluable to doctors treating prisoners and starved civilians during and after World War II.

After World War II Dr. Keys turned his attention to the large number of men who were dying of heart attacks at a relatively young age. He first studied businessmen, ages 39 to 60, because this was the age that many of them were dying prematurely from CHD. If you look at the documentary film on Dr. Ancel Keys on the University of Minnesota Library website, it shows the men stopping in to Dr. Keys’ lab for their annual check up. These businessmen. in one way, were typical men of the 1940s-1950s. They were well fed and slightly overweight. They were usually dressed in a suit. And they appeared to all smoke. But they were not typical of most American men in another way. They were, for the most part, from the upper socioeconomic class found in the urban St. Paul-Minneapolis area. Twenty five percent were the presidents or vice–presidents of large businesses.

Dr. Keys’ seminal observation was that the men who had heart attacks tended to have higher concentrations of cholesterol in their blood. What is truly outstanding about this study is that it is one of the first of its kind. Modern medicine was just entering the age of true advances. The first antibiotic was used during World War II. The science of nutrition was just ending the discovery of vitamins phase. Little was known about why and how heart attacks occurred in middle aged humans who otherwise appeared to be healthy men and, to a lesser extent, healthy women. Although this was an important study it was flawed because of the group of men studied and its small size. However, Dr. Keys learned from this study and it was instrumental in guiding him during the development of the Seven Countries Study.

The research paper for this first study was published in 1963 after the fifteen year follow-up was completed:

Keys A, Blackburn HW, Taylor HL, Brozek J, Anderson JT, Simonson E. Coronary heart disease among Minnesota business and professional men followed fifteen years. Circulation 1963;28:381–395.

http://circ.ahajournals.org/content/28/3/381.abstract?ijkey=dd05bc49dc156911c4402cb92364fb11b2d3eeae&keytype2=tf_ipsecsha

Let’s revisit important parts of this study in Dr. Keys’ own words. Dr. Keys wrote:

“The main purpose of this report is to compare, in respect to the measurements considered here, the pre-disease characteristics of the men who developed coronary heart disease with the contemporary characteristics of their fellows who did not develop the disease.”

“The men in the present study are not a statistical sample of American men or even of middle-aged men in Minnesota. They were drawn from men in the upper socioeconomic class in the metropolitan area of St. Paul-Minneapolis; one fourth are (or were) presidents or vice-presidents of substantial corporations; more than half of the group were college men. This is a native-born and educated group, almost all with ancestral origins in the British Isles, the Scandinavian countries (mainly Norway and Sweden), and Germany.”

Cholesterol was the only parameter that was statistically significant in this study.

“The incidence of coronary heart disease tended to be higher among men above the median at first examination in relative weight, body fatness, systolic and diastolic blood pressure, and serum cholesterol concentration but these segregations were not statistically significant except with serum cholesterol, which was associated with p < 0.001.”

But some men did not have high cholesterol and still suffered heart attacks.

“The general conclusion seems warranted, then, that men who develop coronary heart disease in spite of having relatively low serum cholesterol values are men who tend to be at the upper extremes of blood pressure or relative body weight, or both.”

Conclusions:

This is an very good research paper. Dr. Keys and his colleagues described their methods exquisitely, they reported their findings in a balanced way, and they reported that the study was not representative and that it was too small.

Then they compared their results to the results of several other similar studies being carried on about the same time.

There were no wild hypotheses. There was no bombastic language. There was no indication that a zealot was window dressing his case.

From this rather small study, Dr. Keys and his colleagues went on to design a much larger study that would search for the answers to what was causing massive amounts of heart attacks in American men in the 1940s and 1950s.


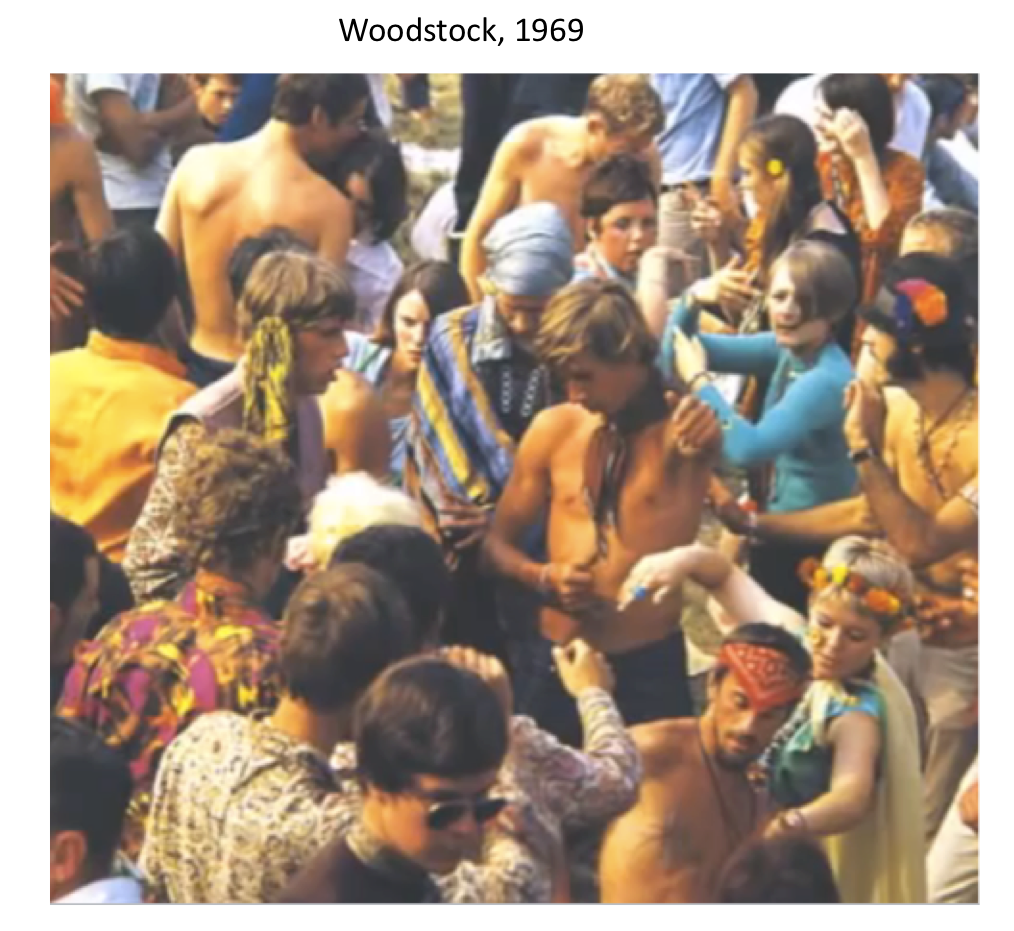
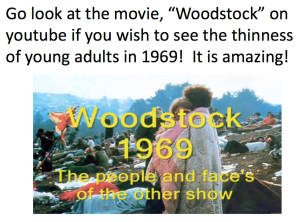
If any of you wish to remember how thin people were back in 1969, or if you are too young and wish to see this for the first time, please look at the movie “Woodstock” on YouTube (turn down the sound if you do not like rock & roll!; also, don’t look if you are upset by nudity, even if it is for science!).  You will be absolutely amazed how thin teenagers and young adults were back then. Of course, you will see some heavy people, too (but very few), as there have been heavy people in most generations (probably because it is an evolutionary survival mechanism).  The following are collages of screen shots taken from the Movie, “Woodstock.”  But to get the full effect, you must go look at the movie to see how thin people were in 1969!

Woodstock 1969 Slide 1

Woodstock 1969 Slide 2

Woodstock 1969 Slide 3

Woodstock 1969 Slide 4

Woodstock 1969 Slide 5

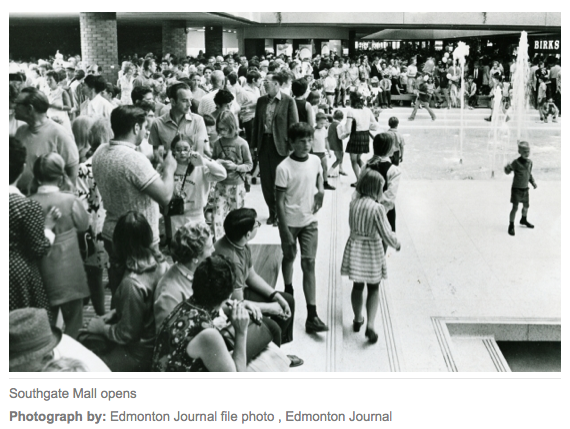
Shopping Mall in 1970:

Mall in 1970

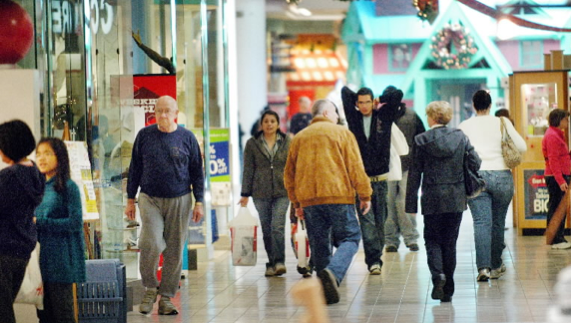
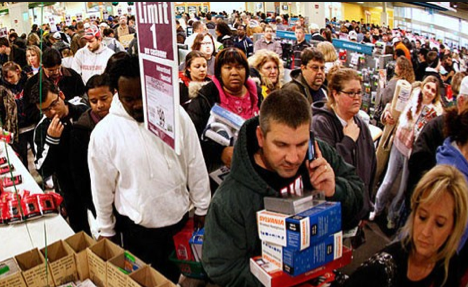
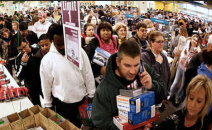
Shopping Malls in 2013:

Shoppers at Modern MallShoppers at Mall Black Friday 2013

As someone who was very heavy as a child, I was happy to find this shot of me in college. The photograph below shows me with my roommates in our senior year (1976) of college at SUNY-Binghamton. We are outside of our house reenacting a famous album cover. I am the first in line and I was thin through the last portion of high school and all through college because I changed my eating habits and became very active, including backpacking throughout the entire western US when I was just nineteen years old.

JLD SUNY Binhamton 1976

Life before computers and obesity

Although I did not make it to Woodstock, I remember life at the time and how different it was from today. I was 15 years old in the summer of 1969 and still in high school. I lived in Brooklyn and city life was all I knew. In order to go to high school, I walked three long blocks up a steep hill and caught a bus to Flatbush Avenue, and then I transferred to a subway for the remaining trip. If I was lucky, I made it in about an hour.

Later when I went to college, I walked about twenty minutes from my dorm to the classroom buildings. When an exam was given that involved math, I needed to use a slide rule to perform calculations because hand calculators were not available yet.

And then in graduate school, when it came time to write my Ph.D. thesis, I needed to use a pencil to write out the chapters in the day and then at night I struggled typing my thesis on a typewriter. The Apple IIE was just becoming popular in the early 1980s (Data on computer availability will be presented in a later Chapter).

Because computers and ubiquitous fast food were not yet available, what was life like growing up in the 1960s and the early 1970s?

Grocery Shopping Before Obesity

I remember many things about my early life that pointed to a very active childhood.   One example is that my mother did not drive, and therefore, when we went to the supermarket, we took out the grocery cart and pulled it behind us. We needed to walk 2 and ½ flat blocks and then we headed down a long steep hill. I hated walking down that hill because I knew that later on we would need to walk back up it. We walked another 3 blocks and came to our local A&P supermarket. We went in, attached our cart to the grocery cart, and then proceeded to go down the first short aisle on the left side of the store. We then moved to the next aisle, which was much longer.  After grabbing groceries from the middle aisle, we went all the way to the rear of the store to cross over to the third aisle.

After making the turn, you then went down the final long aisle to the check out counters. That was it – 3 aisles in all! The A&P was stocked with staples but with little else. This small A&P had a dairy section, a bakery section, a frozen food section, a canned goods section, but few others – not the dozens that are found in modern mega supermarkets today. And one thing our small A&P had very little of were processed foods.

One of my greatest fears as a child (I still have dreams about this even today!) was being asked by my mother to go back and get something that we had forgotten to put into the grocery cart. I could not go back up the last aisle we had come down because the flow of traffic was only one way and I would be run over by the other shoppers. So I needed to slip under the bar that separated the checkouts from the first aisle and then I would navigate back through the entire store to get the needed item. I then needed to weave through the remaining aisles to get back to the check out. The smallness of the A&P made only one-way traffic possible.After paying we would load the brown bags into our pull shopping cart and start the walk back home. And yes, we needed to climb that long hill to get there. I will always remember the pain of going up that hill as a little boy!

Having a child help make the family meal at home

Today as I write this in 2013, it has been reported by several researchers that currently 40 to 50% of money spent on food is spent eating outside the home (I’ll present this data in later chapters). This is an astonishing figure because as a child growing up, my family went out to eat infrequently – maybe twice a year. And usually this was for a special occasion, such as a birthday. We essentially never went out to eat in a restaurant. No one that I knew at the time did. From this we can infer some basic facts. First, when I was a child in the late 50s and early 60s, at least where I lived, most food was consumed in the home, and therefore, most food was prepared in the home.

In order for this to occur a spousal unit needed to be at home in order to shop, prepare, and serve the meals. When I was young, this was my mother, who never worked outside the home. And this was possible because the economic paradigm at the time allowed for one wage earner to support a family, and this allowed one spouse to remain at home.

This basic operational model had other major effects on family life. Since a spousal unit was always at home, the smaller kids could be watched by a parent and taken along on errands and visits around the neighborhood. Being home, a child could help the parent in the kitchen with elementary tasks. This was an excellent opportunity to learn how to cook at a very young age. In an extended analogy, this was not unlike a child following around a mother or father to learn how to gather and prepare food in a Hunter-Gatherers’ village.

If a child in a village can learn helpful family tasks, why not a child in a modern American home?   In fact, this was how I learned to cook, and probably where I carried out my first chemistry experiments. From a very early age I knew how to wash vegetables, peel potatoes, mix ingredients in a bowl, and prepare meats. I was also the person who set the table and put drinks from the refrigerator on the table. After doing this many times – it becomes second nature, like learning a language. When I later went to college it was an essential survival skill to make meals in my apartment. And like learning to ride a bike, cooking is something that you never forget how to do.

Shopping in Manhattan Before the Shopping Mall

When my mother took me with her on a shopping trip, it was an opportunity to eat outside the house, but not at a fast food restaurant, because they did not really exist at the time. My mother would take me with her on the subway into New York City (aka Manhattan). She would shop in midtown at Macy’s or Gimble’s near Herald Square. Usually we ate in a department store cafeteria. But occasionally, we ate at the Horn & Hardart automat in midtown. The automat was a flashy, bright cafeteria style restaurant where there was a large sitting area in the center of walls of shining doors with little windows.

This was such an amazing experience and I always wondered whether there were robots in the back that made the food. Actually there were hard working food service workers but we couldn’t see them. My mother gave me the coins to put into the slots and after putting the money in you turned a knob and then you could open the door and take out the dish with the food. I would eat the baked beans or the macaroni and cheese, both standards at the automat.

My mother would always eat the creamed spinach or a fish cake. This trip to the automat made the long subway ride and the walking through crowds and busy traffic of Manhattan streets bearable. At least there was something exciting to look forward to while my mother shopped. To this day I hate shopping of any kind. I remember having to wait while my mother searched for clothes for my four sisters. She never bought anything for herself. And my feet – they would hurt and sweat the entire time. I can still feel them! After the trip to the store and lunch we headed back home on the subway.

I would fall asleep to the back and worth motion of the subway cars. At our stop my mother would wake me up and then we climbed our way to the street where we would find ourselves near the A&P supermarket I described earlier. Once on the sidewalk we walked back to our house, walking up the same hill that I dreaded when going to the A&P. Finally, we were home!

How was that trip into Manhattan on the subway different than the trip to the mall by car today? We walked at least a half-mile to the subway stop. After descending the stairs we needed to wait for the train. In Manhattan we had to walk up the stairs and then over from 6th Avenue to Herald Square. And on the way back everything was reversed. Today, in most cases people drive to the mall, park their cars, and walk in. They stay for several hours, about the same period of time as we stayed on our shopping trip. They walk through the mall but do not exercise anywhere near as much as we did taking the train. Then they walk the short distance to their cars and get in and drive away. Our eating experience in Manhattan was different than most eating experiences today.

By eating in a cafeteria we obtained basic food to eat and it did not consist of a burger and fries or another popular fast food.   Some common cafeteria foods at the time were a sandwich on toast, tuna fish on a green leaf salad, soup and crackers, a meat with vegetables entree, and don’t forget a bowl of Jello or pudding for dessert.   Drinks were only 8 oz at most. Who would want to drink a 20 oz drink?   We were use to eating normal size means for normal sized people (as least 95% of us were normal sized!).

Once home my mother would start supper and we would eat our dinner at home like we did every other night. But it was certainly a treat to eat in a cafeteria or the Automat. We did eat out, but we also walked a great deal and probably burned all those kcal up.

The one exception – Brooklyn Pizza

There was one exception to the above. If I am to be honest, we did spend money on food made outside the home. After all, Brooklyn pizza is famous throughout the US. Every so often when my mother needed a break, we would order pizza from the local pizzeria. We would call in our order and my father would drive and pick the pizza pies up. This was always a treat for us. Also, on some occasions, when I was older and I was out at a boys club meeting, I would stop on the way home at a pizza place to get a slice. I remember that the price of a slice of pizza was 15 cents. And I remember quite vividly that the price of a ride on the subway was always the same price as a slice of pizza. At the time it was also 15 cents for a ride on the subway. Today in 2013 the price of the subway is $2.25 and the slice of pizza runs from $1.75 to $2.50 depending on the location of the pizza shop. So the relationship is holding up pretty well.

My first fast food experience

It was in the summer of 1969 and some of my older friends were going to go to the Woodstock Music and Art Fair. I asked my mother whether I could go with them. She said definitely not. After all, I was only fifteen years old and I had only one year of high school behind me. My mother had a better idea. I could fly down to Atlanta Georgia and spend a week with my two sisters, Rita and Jeanne.   This coincided exactly with Woodstock. So I flew down to Georgia and I do not have many memories of the trip. However, the one thing that I do remember perfectly is walking across the street from Rita’s apartment and eating a Whopper at a burger king fast food restaurant.

The experience is indelibly etched into my mind. The charcoal broiled burger, the lettuce, tomato, pickle and ketchup. And the mayo on the lettuce. All enclosed in sesame seed bun. How delicious.   High salt, high fat, and I am sure there is sugar somewhere in the concoction. The combination of flavors was a taste orgy to my brain. To this day I remember that experience and sometimes crave a Whopper sandwich. At a moment’s notice I will need to go out and find a Burger King place.   So there was something in that sandwich that caused a pathway of neurons to be laid down in my brain. And whenever there is activity in that pathway of neurons, I need to go out and find and eat a Whopper! Nothing else will satisfy me.

Driving to College Before obesity – difficult to eat on the way

After high school I went to college in upstate New York. Once a week I tried to call home, usually on the week end. There was one telephone booth and if you did not wish to wait on a long line, you needed to get up early on a Saturday morning to make a call. There were no private telephones or cell phones.

After trips back home or at the beginning of a semester, I would drive up to college either with a friend , or later on by myself when I had a car.

When it was time to drive back to college I packed the car and took off about 10 am.   I was driving from Brooklyn to Binghamton NY and I had eaten breakfast but did not pack a lunch. After navigating the roads out of New York City, I was on the NY State Thruway and would soon take route 17 to head northwest to Binghamton. It was getting near 12 noon and I was a little hungry. I just put it out of my mind and made a note to stop at the Roscoe diner in about an hour. The traffic was fairly light and I made good progress. I exited at Roscoe and pulled into the Roscoe diner’s parking lot.It was packed and I knew immediately it would be a long wait to get seated and then eat lunch.

I walked in and when I heard it would be 40 min wait before I could sit down, I just turned around and got back into the car. I put my hunger away and continued on my trip to Binghamton. Several hours later when I arrived at my apartment, I looked in the refrigerator. There were a few very suspect food items in there. I walkeddown to the local grocery to buy some bread and cheese. I made myself a sandwich and drank some milk. I was finally not hungry. It wasn’t a big deal. It was 1974 and it was typical to make the drive between NY and Binghamton without eating. After all, there were few places to eat along the way.   There were certainly no fast food places to stop. At least none I can remember. And not seeing a restaurant at every exit didn’t coax me into stopping and eating. Not having an easy place to stop and eat was very common at this time before the appearance of the obesogenic environment in the United States.

Conclusions

The conclusions from the above stories is that it was necessary to perform energy intensive physical activities in order to carry out everyday life events. Even the process of making dinner in the home required work that helped burn kcal in the preparation of family meal. Today, even in some cases if you still need to perform physical activities in the daily routine, it is easy to stop and consume a fast food meal. Why the pre-1980s was less obesogenic revolves around the sum of every day activities that required energy expenditure and the inability to quickly stop and eat a high kcal fast food meal.


Ancel Keys Book Cover 5-2014

Ancel Keys’ studies certainly raised concerns about the intake of a high fat and cholesterol diet on blood cholesterol concentrations and its effects on Coronary Heart Disease (CHD). As I indicated earlier, at the time of his studies the rates of CHD were much higher in the US than in Europe (except for those in East Finland), and Ancel Keys specifically acknowledged in his book that he could not explain this observation. In part 2, I discussed the introduction of margarine into the US market in the 1950s as being a possible reason for this observation. There is one other possible factor that Dr. Keys mentioned in his book published in 1980. This was that additives were included in American cigarettes that made them burn more rapidly and efficiently, allowing them to deliver higher concentrations of nicotine and other deadly chemicals to the American smoker. This was in contrast to cigarettes consumed in Europe, especially in southern Europe, that were often hand made by the smoker, and thus they burned less efficiently. Since most of the participants in the Seven Countries study were men who were smokers or ex-smokers, the difference in cigarette manufacture may have been an important factor, outside of diet or other factors such as activity, in the difference in the basic rate of CHD between the the US and European countries.

There was one other interesting factor that influenced blood cholesterol concentrations at the time of the Seven Countries study. People made coffee by using a coffee percolator, which essentially uses steam from boiling water/coffee to extract the coffee grounds. This process was extremely efficient at extracting flavors and other compounds from coffee, including a substance that was later found to increase blood LDL concentrations. I remember vividly my father making his morning coffee using a coffee percolator. Later on, drip coffee makers became more common and this process did not extract the LDL raising substance out of the coffee. This may have been another reason why blood cholesterol levels were higher in the 1950s and 60s. Therefore, the concentrations of cholesterol in blood of Americans probably fell slower in response to a lower fat and cholesterol diet than would have been predicted, because other factors, such as the consumption of margarine and drinking percolated coffee, were responsible for keeping blood cholesterol concentrations artificially high.

Dietary Guidelines and the War on Fat and Cholesterol

The studies of Ancel Keys and other researchers such as Mark Hegsted did not go unnoticed by health administrators and advocates. In 1976, the Select Committee on Nutrition and Human Needs, chaired by Senator George McGovern, held hearings on the role of diet in the development of the chronic diseases that were raging at that time. In 1977, this Congressional Select Committee issued the “Dietary Goals for the United States.” The recommendations of this report were:

Increase carbohydrate intake to 55 to 60 percent of calories

Decrease dietary fat intake to no more than 30 percent of calories, with a reduction in intake of saturated fat, and recommended approximately equivalent distributions among saturated, polyunsaturated, and monounsaturated fats to meet the 30 percent target

Decrease cholesterol intake to 300 mg per day

Decrease sugar intake to 15 percent of calories

Decrease salt intake to 3 grams per day

The problem with the 1977 Select Committee report was that they took general recommendations made by a number of health researchers and then included precise percentages for some of them, such as the ones for macronutrient intake, in the final recommendations. Increasing carbohydrate intake to 55 to 60 % of total kcal is probably too high of an intake of carbohydrates, especially if 15 -20 % of total Kcal come from simple sugars. Likewise, decreasing total fat intake to 30 % percent of total kcal intake is probably too low. We now know that the type of fat consumed is more important than the total amount of fat in the diet. But really, the recommendation of 55-60% of kcal from carbohydrates was probably unwise, and at the time, unsupported by the current knowledge.

Also, the Select committee report was from a committee in Congress and was largely written by congressional staff members. Efforts to produce recommendations from a scientific committee or agency were then engaged. In 1980, Health and Human Services and USDA released, in a combined report, “Nutrition and Your Health: Dietary Guidelines for Americans,” first edition. The recommendations in this document were more general than those in the previous “Dietary Goals” from 1977. The 1980 “Dietary Guidelines” recommended:

Eat a variety of foods

Maintain desirable weight

Avoid too much fat, saturated fat and cholesterol

Eat foods with adequate starch and fiber

Avoid too much sugar

Avoid too much salt

If you drink alcohol, do so in moderation

There were no numeric recommendations for % kcal from fat and carbohydrate.

The 1985 release of the “Dietary Guidelines for Americans,” second edition, contained almost the exact recommendations that were in the first edition from 1980. In 1989, the USDA and HHS convened a second expert committee to review the 1985 edition of the “Dietary Guidelines.” In 1990 this panel released the third edition of the “Dietary Guidelines,” and this version contained numerical recommendations for the % intake of total fat and saturated fat. Again, the recommendation was that total fat should make up 30% or less of total kcal, and that saturated fat should make up less then 10% of total kcal intake. If fat contributes only 30 % of kcal, and protein contributes about 15-20% of kcal, this recommendation implied that carbohydrates should contribute about 50-55% of kcal to the diet. The basic question here is, was it correct to recommend that the American public should consume 50 % of their kcal, or more, in the form of carbohydrate?

The recommendations on macronutrient percentages and what types of fat to eat were still somewhat immature at this time (1970s to 1980s). Health experts were still basing their recommendations on the outcome of Ancel Keys’ Seven Countries study and other short term dietary intake studies. As discussed previously, deaths due to CVD in the 1950s and 1960s were due to a number of causes, including the consumption of trans fats in addition to the consumption of saturated fat, the smoking of efficient, toxic cigarettes, and possibly, the drinking of coffee made with a percolator.   Additionally, Americans were becoming increasing inactive.

To answer this question, let’s consider an evolutionary argument concerning what percent of total kcal intake should come from fat and carbohydrates in humans.

Studies of various and diverse cultures have shown that humans, throughout evolution, consumed a wide range of diets with different macronutrient make-ups. This last point was wonderfully illustrated in a recent article by Leonard (   ).

Below is a table extracted from this article.

History of Macronutrients Table

The upper values for percent macronutrient content of the diet are values taken from selected studies of hunter-gatherers and studies of pastoral and small, basic agricultural societies. The lower data are values for the intakes of Americans (an industrial society) from the 1950s to current time. The percent kcal from protein is, for the most part, higher in subsistence-level and simple agricultural humans than in the American diet. The values for percent kcal from carbohydrates and fat are quite varied. This shows that humans can adapt and utilize diets with differing levels of these macronutrients. As eloquently stated by Dr. Leonard, “This ability to utilize a diverse array of plant and animal resources for food is one of the features that allowed Humans to spread and colonize ecosystems all over the world.”

The lower values for Americans show an interesting trend. In the 1950s the intake of fat was relatively high (approximately 45%), and then it decreased during the last decades of the 20th century in response to recommendations by various health authorities and the published “Dietary Guidelines.” Finally the percent of kcal from fat is currently increasing due to relaxation of the impact from fat phobia and due to the beliefs of many that a high carbohydrate is not healthy either.

However, the take home points from Dr. Leonard’s article are that the actual percentages of the different macronutrients are not as important as the composition of each of these components. Human populations can live over a wide range of macronutrient intakes, but as we will discuss later, the content of the individual components in each category are extremely important.

Going back to the original McGovern “Dietary Goals” (1977), it was recommended that Americans “Decrease sugar intake to 15 percent of calories.” Additionally, the first edition of the “Dietary Guidelines,” (1980) recommended, “Avoid too much sugar.” Therefore, these very general recommendations were correct for some of their recommendations concerning carbohydrate intake. However, the food companies increased the amount of sugar in their products, and of course, Americans consumed these foods in ever increasing amounts.

Conclusion

In conclusion, although the different Dietary recommendations made starting in 1977 could have been more prudent, in no way can they be blamed for starting the Obesity epidemic.


The findings in the 1950s and 1960s that high blood cholesterol was associated with CHD and that dietary cholesterol and saturated fat could influence blood cholesterol initiated a 4 to 5 decade war on the intake of fat as a causative factor of cardiovascular disease. The only problem with this approach was the fact that the real story was much more complicated than any investigator could imagine or studies at the time could show.

There is one additional factor that needs to be discussed here that is almost never taken into account in a review of the development of the “fat as evil” story. And this factor may have inserted a major confounding effect into the entire story of fat as the cause of cardiovascular disease story.

In the 1940s American food companies supported the introduction of a relatively new product onto the foodscape. This product was the result of efforts to find a way to sell excess vegetable oils. The product was called margarine. The product was advertized to be healthy compared to the “evil” butter, and it was cheaper, too. There was only one major problem with margarine, unknown at the time, which was that during the process of hardening of liquid vegetable oil into solid bars, toxic fatty acids, called trans fatty acids, were formed during the hydrogenation process. On the slide below the per capita consumption of margarine is shown for the US. Note that the half maximal intake of margarine occurred in the US about 1953, and that consumption leveled off about 1969 and lasted as a long plateau until 1990. So maybe fat intake, in part, was responsible for increased cardiovascular disease during this time. However, much of this effect may have been due to the introduction of margarine as a major food product.
Margarine Intake US 1909 to 2001

The figure below shows the composition of margarine versus butter and tub (soft) margarine. Whereas butter is 51% saturated and contains 3% trans fatty acids, margarine contains 21% saturated and 24% trans fatty acids. The 24 % trans is considered much more dangerous than the saturated fatty acids found in butter. Studies have shown that trans fatty acid raise LDL cholesterol and lower HDL cholesterol, changes that would greatly increase the risk for CHD. The composition of stick margarine was undoubtedly more atherogenic than the composition of butter. Therefore, increasing consumption of margarine would probably camouflage much of the improvements in CHD risk accomplished by lowering total intake of fat and cholesterol in the American diet.

Margarine Composition w Labels

Figure: Composition, in grams per 100 grams of product, of butter and of the average stick margarines (N=32) and tub margarines (N=17) used in the 20 experiments reviewed. Sat, saturated fatty acids; Trans, trans fatty acids; Mono,cist-monounsaturated fatty acids; Poly, polyunsaturated fatty acids; and H20, water plus glycerol and other minor substances. Butter contains about 220 mg, vegetable margarines less than 1 mg, and margarines made with animal fats 70–275 mg cholesterol per 100 grams of product. (Zock PL, Katan MB., Butter, margarine and serum lipoproteins. Atherosclerosis. 1997 May;131(1):7-16).

Studies in Finland, the country with the highest rate of Coronary Heart Disease

In Ancel Keys’ seven countries study, the country that had the highest incidence of CHD was eastern Finland. The population of eastern Finland was known to have a very high intake of fat, including a very high use of butter in every day meals. Therefore, if high intakes of saturated fat and cholesterol intake were responsible for the high rates of CHD, then efforts to decrease their intake in eastern Finland would have the best chance to show the efficacy of lowering serum cholesterol. Through most of this period, margarine intake was fairly low and constant, and therefore, if the people of Finland decreased their serum cholesterol concentrations through diet, especially those with very high cholesterol levels, the full beneficial effects of lipid lowering on CHD should have been observed directly. This is exactly happened. Health officials instituted programs to educate the population on the effects of eating high levels of fat, and their intake did indeed fall.

Below is a figure that shows serum cholesterol distribution in men, aged 30 to 59 years, in Finland by study year. From 1972 to 1992, the distribution of cholesterol shifted left, such that the mean cholesterol in men decreased from 262 mg/dl to 228 mg/dl. In a 25 year period from about 1970 to 1995, mortality from CHD in eastern Finland decreased to about less than half of that previously observed, with decreased cholesterol concentrations responsible for about half the decrease in CHD (the other half being due to lower smoking and decreased blood pressure).

Cholesterol Distributions in Finland

The figure below shows the decrease intake of table fats in Finland. During the course of the study the intake of total table fats, and butter in particular, decreased. The consumption of margarine stayed consistent. Interestingly, the consumption of cheese, not considered a table fat, increased during the study.

Butter Intake in Finland

In Finland, the serum cholesterol concentrations decreased steadily from about 1970 onward, and the incidence of CHD also decreased during the period. In the US, the rate of deaths from CHD declined much slower, as did the serum cholesterol concentrations.   One factor that may have been responsible was the large increase in the consumption of stick margarine, starting in the 1950s in the US.

However, there is really no way of knowing how detrimental the increased consumption of margarine was for the American public. One thing is for sure, Dr. Ancel Keys had no idea that, exactly when his study was being conducted, the intake of a dangerous fat (trans fat) was steadily increasing. This is the perfect example of the “Something Else Hypothesis,” which posits that, in certain instances, something totally different, essentially an unknown unknown, may be the actual cause of the results being observed in a research study, and not the reasons the researchers have carefully extracted from analysis of the basic data. There was no way that Ancel Keys could have known that his entire study, at least the American portion of it, was being undermined by the introduction of margarine into the US diet.

« Newer Posts - Older Posts »

Categories