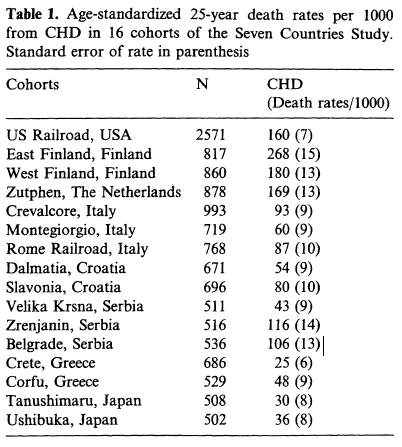
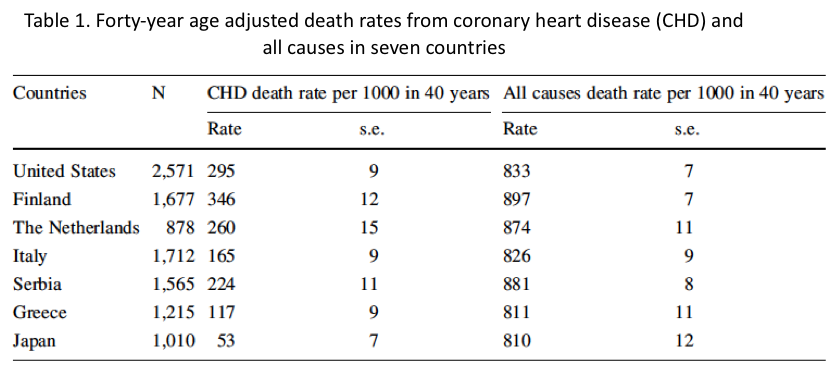
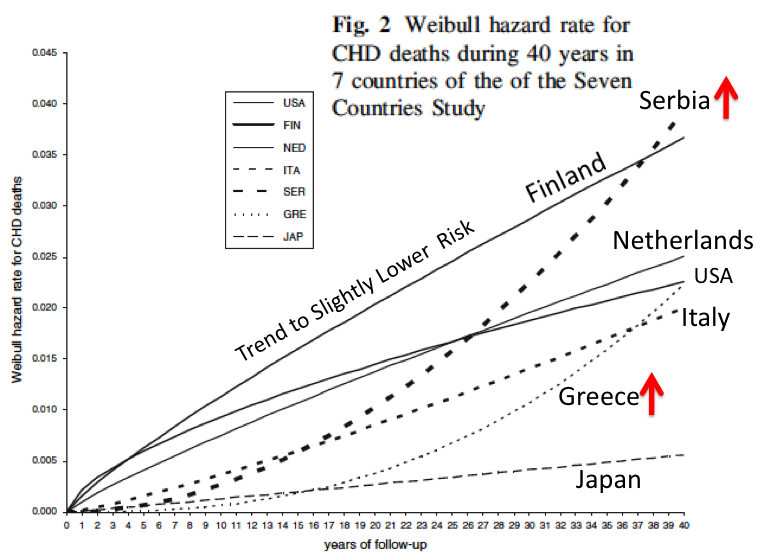
As we observed in earlier chapters, the observations from the Seven Countries and Framingham studies, and other smaller studies, pointed to the diet and the resulting blood cholesterol as being important in the development of CHD. But it is also apparent that the very high rates of CHD observed in the 1950s were due to multiple other factors, including high blood pressure, the smoking of very efficient cigarettes, low exercise, weight gain in middle age, high stress levels, and the consumption of toxic trans fatty acids in margarine.

The dietary guidelines that were released in the late 1970s and through 1990 reflected concerns about total and saturated fat in the diet.  Here are the sections that are most pertinent for our discussion:

The McGovern Committee 1977 “Dietary Goals for the United States.” recommended:

1. Increase carbohydrate intake to 55 to 60 percent of calories; 2. Decrease dietary fat intake to no more than 30 percent of calories, with a reduction in intake of saturated fat, and recommended approximately equivalent distributions among saturated, polyunsaturated, and monounsaturated fats to meet the 30 percent target; 3. Decrease cholesterol intake to 300 mg per day; 4. Decrease sugar intake to 15 percent of calories; 5. Decrease salt intake to 3 grams per day.

The 1980 “Dietary Guidelines” recommended:

1. Eat a variety of foods; 2. Maintain desirable weight; 3. Avoid too much fat, saturated fat and cholesterol; 4. Eat foods with adequate starch and fiber; 5. Avoid too much sugar; 6. Avoid too much salt; 7. If you drink alcohol, do so in moderation.

The 1990 “Dietary Guidelines,” brought back recommended percentages:

1. Total fat should make up 30% or less of total kcal; 2. Saturated fat should make up less than 10% of total kcal intake (Implied: If fat contributes only 30 % of kcal, and protein contributes about 15-20% of kcal, carbohydrates will contribute about 50-55% of kcal to the diet).

In short, the major trend suggested by these recommendations were to decrease fat intake from about 40% of total kcal to 30% or lower, and the natural compensation for this would be increase carbohydrate intake from about 40% of total kcal to 50% or higher.

We should remember that the experts who participated in these recommendations were reacting to the known information at that time on the effects of diet on blood cholesterol and its effects on CHD. These experts did not have all the information concerning LDL and HDL, or about other risk factors that were have been studied since then.

Although the Dietary Guidelines may have contained premature recommendations, the review by Leonard (2014) makes the convincing argument that humans have consumed diverse diets throughout evolution and should be able to adapt to such relatively small to moderate changes in the contributions of macronutrients to the diet.

W. Leonard, 2014

http://www.sciencedirect.com/science/article/pii/S0031938414001206

However, these basic recommendations have been labeled, by some authors, as the primary reason for the obesity epidemic that started about 1970.

Is this a reasonable argument?

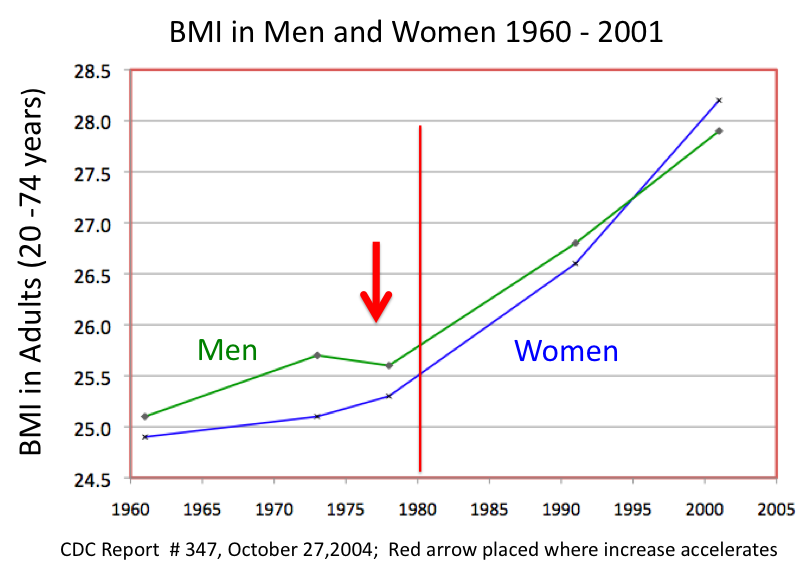
Actually, life was changing in many different ways and looking at all the different changes that occurred in the past 40 years will provide evidence that the obesity epidemic was the result of many changes in the multifaceted aspects of modern day life. First, let’s look at the changes in the obesity rates in the United States over this period of time.

The increase in obesity in the US is shown in the next series of slides

INCREASE IN OBESITY IN AMERICA

Percent Increases Between Surveys

Increase in BMI

What other changes were taking place in the US in the period after 1970?

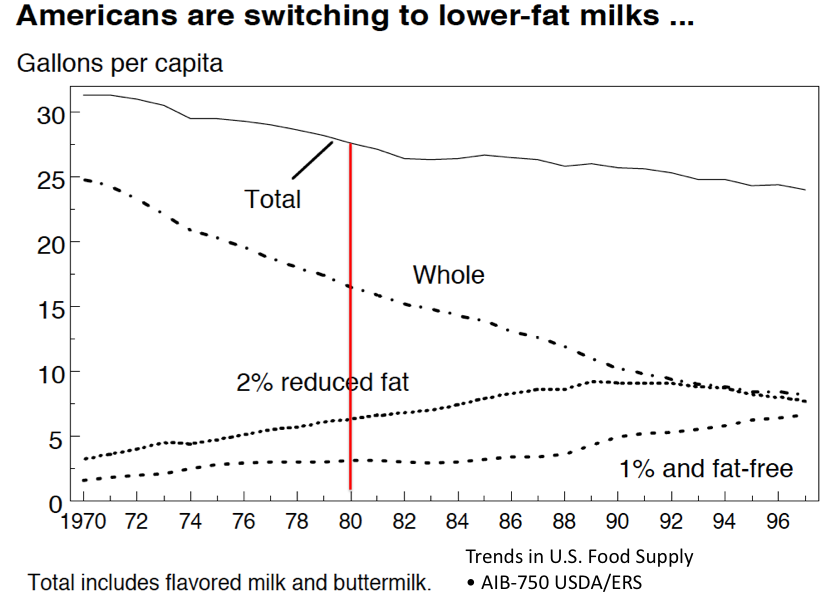
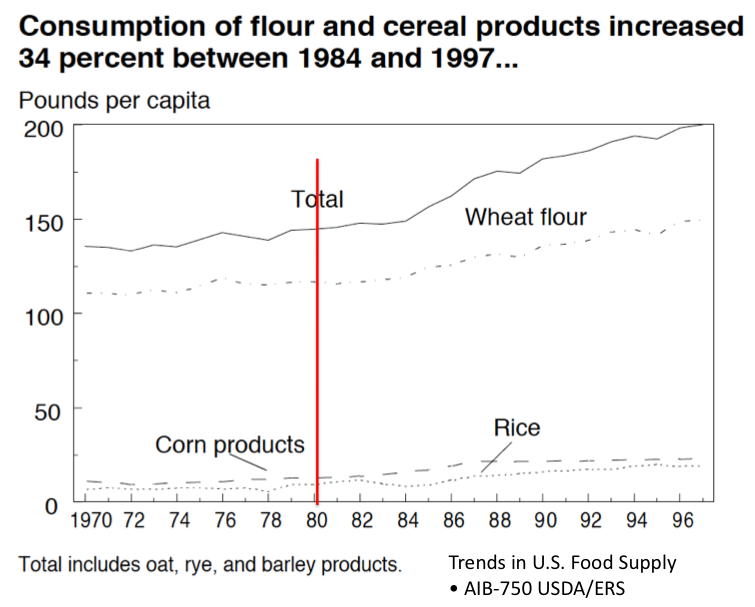
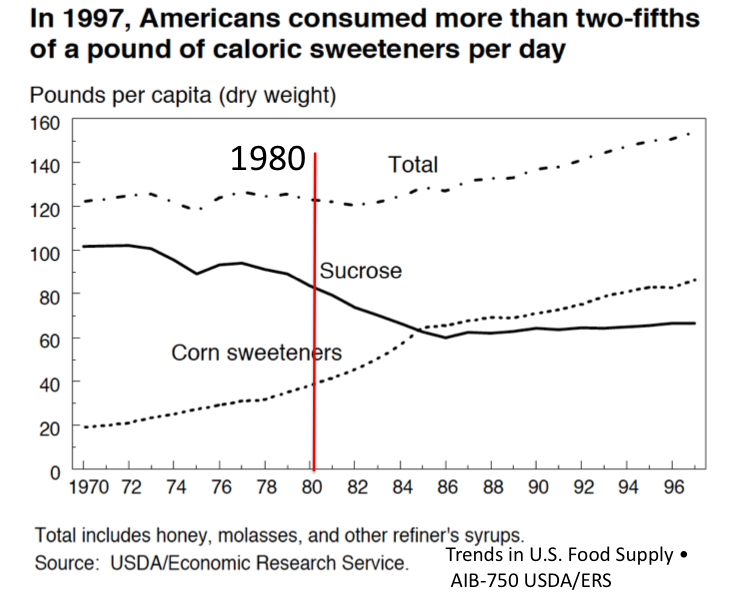
What changes in food consumption occurred during the period 1970 to approximately 2008?

Food Availability 1970 to 2008

Meat Consumption

Milk Consumption

Cheese Consumption

Vegetable oil consumption

Consumption of grains

Consumption of Sugars

Soda Consumption

Percent of food eaten out of the home

Sales in Fast Food Places

Subway in 1970

Subway in 1995

Subway in 2013

Summary

The following observations were made above concerning food intake per capita in the period since 1970:

Total kcal intake is Up

Meat intake was maintained

Total fat intake is Up

Milk consumption is Down

Cheese consumption is Up

Total sugars and sweeteners intakes are Up

Conclusions:

Blaming the Dietary Goals for the Obesity Epidemic is ridiculous. Total kcal intake increased and both fat and carbohydrate intake increased too over this period of time. The blame game when it comes to macronutrients in the diet has been used by hundreds of so called nutrition experts who use it to write books that are purchased by unsuspecting consumers. Unfortunately, this blame game is nothing but a giant red herring. Additionally, it is absolutely clear that segments of the food industry totally paid lip service to the Dietary Guidelines. As so magnificently described by journalist Michael Moss, food companies were learning slowly but surely how to produce food products that hit the “bliss point,” making processed foods  difficult not to consume in excess amounts.

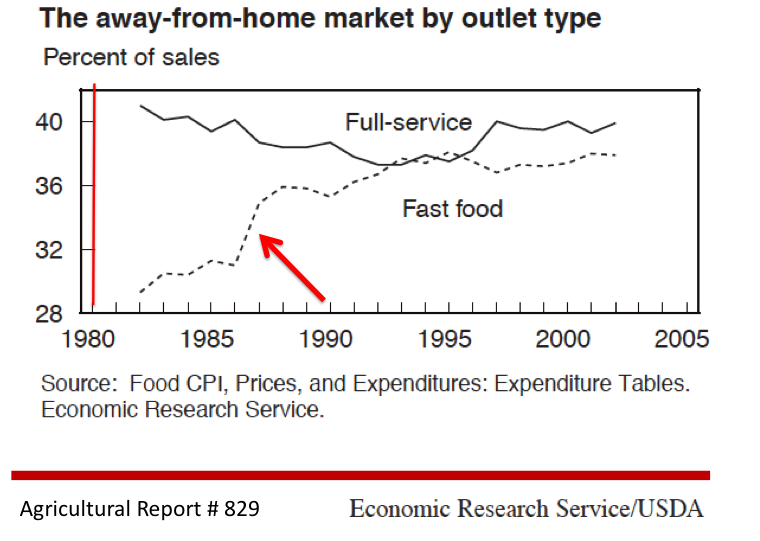
Furthermore, the agricultural revolution in the US led to increased availability of kcal in the US, and myriad companies produced more and more tasty products for the American consumer to buy.  Additionally, the fast food industry increased greatly during this period, such that food was available on every corner and at every highway exit, leading to the fact that more and more food was consumed outside the home.

In the next chapter, we look at another great change that occurred in society after the 1970s to influence weight gain in the US.

Much of what we know about risk factors and Coronary Heart Disease (CHD) has come, first and foremost, from the Framingham study.   When Ancel Keys published in 1963 his fifteen year follow-up study on coronary heart disease in Minnesota Businessmen, he acknowledged that his study was too small, and also it did not follow a representative sample of men as most of the men in the study were from a high socio economic level (discussed in an earlier chapter). In the discussion section of the article, Dr. Keys compared the Minnesota study with that of several other studies ongoing at the time, including the Framingham study. Dr. Keys entered all the data from his subjects and data from the Framingham study (after 8 years of follow-up) and data from subjects from another study that was being conduct in Albany, New York, into table 5 of the article. The analysis of this table was straight-forward. Even back then, in the early portions of the Framingham study, it was clear that “the incidence (of CHD) rises sharply with increasing pre-disease serum cholesterol level.” In the last paragraph of the article, Dr. Keys wrote,

“Comparison with similar follow-up data from Framingham, Massachusetts, Albany, New York, and Chicago, show a high degree of concordance. In all series relative weight had least significance and the incidence of coronary heart disease rose continuously with the serum cholesterol level. With men classified according to pre-disease cholesterol level, about 80 per cent of the total variance in relative subsequent risk is accounted for by regression of risk on the cholesterol value raised to any power from 2 to 3 and the correlation between observed and predicted relative risk is of the order of r = 0.9.”

Of course, Ancel Keys went on to set up the Seven Countries study and Dr. Keys’ work was very instrumental in the design of the Framingham study as an epidemiological study to discover risk factors that contributed to the development of CHD.

Why was the Framingham study conducted?

Just in fall 2013 a review of the history of the Framingham study was published because it was the 65th anniversary of the start of the Framingham study (FS) in 1948.

http://www.sciencedirect.com/science/article/pii/S0140673613617523#

The FS had its roots in the heart disease suffered by President Franklin D. Roosevelt, and the masses of Americans with heart disease (roughly half of all Americans) at that time. In 1948, President Harry Truman signed into law The National Heart Act, which was enacted because “the Nation’s health is seriously threatened by diseases of the heart and circulation, including high blood pressure…”   The city of Framingham was chosen as the site of a study because it was a small city comprised mainly of middle class residents of predominantly European origin (which resembled the population of the US at the time) and it was also close to Boston and the expertise of the Harvard Medical School.

The plan was to recruit 6000 out of the 10,000 adult residents of Framingham and follow them for as long as possible to determine what factors were important to the development of CHD. The first enrollees were examined on September 29, 1948.

By 1952 the first cohort of 5209 residents had been recruited, and the first scientific paper from the study was published in 1957. The paper reported that CHD was 4 times higher in residents with high blood pressure compared to residents with normal blood pressure, an observation that was quite unique at the time. Several hundred papers have been published from the Framingham Study.

In 1971 the Framingham study commenced the recruitment of the children of the original residents and their spouses. The second and third directors of the study (Thomas Dawber, M.D., William Kannel, M.D.) wished to find out how to prevent CHD, instead of finding treatments for patients who were already ill, as was the main emphasis of the practice of medicine at the time. In taking this approach, they were the first to use the term, “risk factor” in their work and publications. The Framingham Risk Score later became the basis for the risk calculator used by the National Cholesterol Education Program.

The first major findings in the FS centered around the role of hypertension in the development of CHD, and the investigators also studied how the heart itself changed with the disease. They reported the novel finding that residents with asymptomatic left-ventricular systolic dysfunction suffered heart failure at greatly increased rates.

In addition to direct measures of heart health, the FS pioneered the use of metabolic risk factors to predict disease. Following the lead of Ancel Keys, the Framingham investigators measured serum cholesterol, and then went on to measure lipoprotein fractions with ever increasing precision. In 1977 they reported the landmark observation that HDL cholesterol concentration was inversely related to the incidence of CHD. This was a major advance in the study of lipid metabolism and the development of CHD. Their observations were eventually supported by other studies such as:

Gerd Assmann, Helmut Schulte, Arnold von Eckardstein, Yadong Huang; High-density lipoprotein cholesterol as a predictor of coronary heart disease risk. The PROCAM experience and pathophysiological implications for reverse cholesterol transport. Atherosclerosis 124 Suppl. (1996) S11-S20

Gerd Assman HDL Slide 1996

We now understand the different functions of HDL and LDL in the movement of cholesterol throughout the body, and this original observation from the Framingham study completely fits with the known functions of these lipoproteins.

In 2002 the FS began to recruit the third generation of participants, who are the grandchildren of the original residents. The multigenerational nature of the study lends itself to studies of the genetics of lipid metabolism and the development of CHD. Besides precisely defining the risk factor profiles for CHD, other major findings of the FS were:

1. Systolic pressure was superior to diastolic pressure in predicting CVD – April 1971

2. Type 2 Diabetes mellitus increases CVD mortality-Feb 1974

3. Non-rheumatic atrial fibrillation is a risk factor for stroke – Oct 1978

4. Postmenopausal estrogen use and smoking are linked to    CVD – Oct 1985

The observation from the Framingham study that HDL was protective against CHD explained some of the anomalies in the cholesterol story that were debated in the nutrition and medical fields. When serum cholesterol was very, very high, most likely it was due to a high LDL cholesterol. This corresponds with Ancel Keys’ observations that very high cholesterol concentrations were highly correlated with CHD across many countries. With intermediate cholesterol concentrations, the cholesterol in the blood could be the result of either changes in LDL cholesterol or HDL cholesterol. Therefore, with the insertion of the extra complexity that some cholesterol is hazardous and other cholesterol is protective, there was more variance in populations concerning the association of total cholesterol with CHD.

In fact, in some of the later reports from the Framingham Study, when the total cholesterol value was divided by the HDL cholesterol, the resulting value was a much better predictor of CHD than measuring LDL cholesterol (http://www.jlr.org/content/35/5/779.long  )

This was confirmed recently by a study that was designed to test which lipoprotein or cholesterol parameter was more precise in its predictive value. Total cholesterol/HDL cholesterol was still as good as any other clinical chemistry measurement that is currently being performed in predicting the probability of CHD. (http://jama.jamanetwork.com/article.aspx?articleid=208432   )

New Knowledge about Blood Lipids and Lipoproteins from the Framingham Study and Concommitant Studies

We now know that there are two major pools of cholesterol in blood, with high levels of cholesterol in LDL being hazardous and high levels of cholesterol in HDL being protective.

LDL and HDL in Blood

Additional studies defined the roles of LDL and HDL lipoproteins.

LDL and HDL Roles Table

Roles of LDL and HDL in the Blood

LDL is formed from VLDL secreted by the liver. If LDL in blood is very high, LDL is able to enter the artery wall in the major conduit arteries of the heart. HDL, which is secreted in a cholesterol poor particle, permeates throughout the blood of the body and scours up any extra cholesterol (like a cholesterol vacuum cleaner) and delivers back to the liver. For many decades HDL keeps arteries from progressing to CHD. As with LDL receptors, the HDL concentration declines with age, therefore, this allows atherosclerotic disease to progress in older humans. Of course, humans with low HDL have higher risk for CHD.

Metabolism of HDL in Blood

Below is a theoretical breakdown of LDL and HDL cholesterol in blood with fairly extreme examples of a low serum total cholesterol with optimal levels of LDL and HDL cholesterol compared to a high serum total cholesterol with high risk factor levels of LDL and HDL cholesterol. At the bottom the Total cholesterol/HDL cholesterol is calculated and the high cholesterol example presents with an extremely high value of 8.

Theoretical LDL and HDL Breakdown

As the 1980s were approaching, more and more information was becoming available concerning risk factors for CHD. The Seven Countries study was responsible for showing that diet had a significant influence on CHD. The Framingham study more precisely defined the lipoprotein profiles that were either protective or hazardous.

But there were still many other factors that could influence health and disease. Obesity increased the development of CHD about 10%. Exercise was protective. And as we will find out later, other constituents in the diet could have effects on the development of CHD. But at this time, in the 1980s, most of the metabolic experimental evidence that was known concerned lipids. But many other discoveries were yet to come.


There is no other molecule that instills more anxiety in humans than cholesterol. Go to the doctor and if he or she tells you that your blood cholesterol is too high, you will begin to worry about your health and the possibility of future problems with heart disease.

While teaching my class in nutrition and health over the past twenty-five years, I have attempted to give a more balanced view of cholesterol and the only way to do this is to explain what cholesterol does. The way I do this is to compare plant cells and human cells. Plant cells have a membrane that surrounds every cell, but in addition, plant cells have an exterior cell wall that is thicker than the cell membrane underneath it. Human cells do not have a cell wall, and therefore, their cell membranes need to be strengthened. The way mammalian cells strengthen their membranes is to insert cholesterol into them. The slide below shows how I envision how cholesterol plays a role as a structural molecule. Cholesterol has 4 rings that can be stacked on top of each other in the membrane, just like a common building material, the cinder block! The next slide shows cholesterol situated in in the membrane. When cholesterol is in the membrane, it promotes organization and strengthens it.

Cholesterol Molecule

Cholesterol in membrane

Early studies showed that cholesterol in the membrane prevents movement of the fatty acyl chains of phospholipids in the membrane, a process that is called fluidity. When phospholipids are held in place, the membrane is more rigid, thus stronger. In the red blood cell membrane, there is approximately 0.9 cholesterol molecules for every phospholipid molecule. In other types of cells, there is about 0.25 to 0.5 cholesterol molecules per phospholipid molecule. However, in brain, the myelin sheath that surrounds nerve cells is rich in cholesterol as it contains about 1.3 molecules of cholesterol per phospholipid molecule.

The greater the amount of cholesterol in a membrane, the less water, glucose, glycerol, sodium, potassium, and other small molecules that can diffuse through the membrane.

Additionally, cholesterol in the membrane is important for certain proteins in the membrane to function properly.

The cholesterol molecule emerged early in evolution and because of it properties, it was used by early organisms for other purposes besides making the membrane stronger. One of the other purposes of cholesterol is to supply the starting molecule for the synthesis of the steroid hormones. Therefore, testosterone, estrogen, cortisol, progesterone, vitamin D, and many other steroid hormones are all made from cholesterol.

A third major function of cholesterol in the body is that it is used in the synthesis of the bile salts, which are secreted into the lumen of the intestine to solubilize lipids from foods. Without bile salts the efficiency of the uptake of dietary lipids would be greatly reduced. A fourth function is that cholesterol Is required for neuron function and the process of learning and the establishment of memory.

Therefore, cholesterol plays several important roles in the body and we would not be able to survive without it.

How much cholesterol is in the body?

A 70 kg male has about 140 g of cholesterol in his entire body of which 32 g (22%) are in the brain and nerves, 22% is in adipose, connective tissue and blood, 21% is in the muscle, and the remaining 35% is distributed throughout the other tissues. To put the amount of cholesterol in the diet into perspective, most Americans consume 100 to 500 mg of cholesterol per day.   An intake of 200 mg represents 0.2g/140g of the cholesterol in the body; this dietary cholesterol represents 0.14 % of the cholesterol in the body of a 70 kg male.  (Values from Table 2.1, p. 7, of “Cholesterol,” by John R. Sabine, 1977, Marcel Dekker, New York)

If cholesterol is a such an important and necessary molecule, why is it so bad for us?

Cholesterol is bad for us when it builds up in the wrong place. One of those places is the blood where cholesterol is carried mostly in LDL particles.   For most of us, for most of our lives, there is no problem with cholesterol in the blood. But with age the number of the LDL receptors in cells declines (like many other functions decline with age) and the LDL concentration in blood builds up (See diagram of this below).  With increased LDL in blood, over time, the LDL particles can enter the artery wall and start to build up within the wall. Therefore, cholesterol also builds up within the artery wall and can become so concentrated that cholesterol crystals begin to form. At some point this becomes severe, and with the occurrence of several other events, may cause the blockage of the major conduit arteries (coronary arteries) in the heart, causing a heart attack.

LDL Receptors in Liver

So for the most part, the system that controls cholesterol in the body works fine until we start to get into our 50s or older. Remember, up until recently, most humans did not live longer than 50 years of age. Therefore, having the cholesterol regulatory system break down after age 50 had little effect on human evolution and survival. Of course, with the consumption of certain diets, the blood cholesterol can be driven higher, and then problems with cholesterol regulation occur much earlier than 50 years old. Also, as was observed with patients who had familial hypercholesterolemia (FH), or in patients with other hyperlipidemias, the system that controls cholesterol can be genetically disturbed and cause heart attacks even in young humans.

How does diet affect the cholesterol regulatory system in humans?   How does high LDL cause the blockage of arteries?

These are extremely complex questions and they are still controversial,  We will put this discussion off until we discuss statins in a later chapter.

To be honest, the precise structure of cholesterol in membranes is still being studied and debated. For example, cholesterol and sphingomyelin are closely associated and form 1:1 dimers in the membrane. Also, the membrane contains different regions of organization and cholesterol is required to form these distinct regions.  Cholesterol is crucial to the formation of the correct orientation of membrane proteins in the membrane by providing hydrophobic regions and changing the membrane thickness in certain regions of the membrane.  A recent review of this topic is presented in:

Garth L. Nicolson, The Fluid—Mosaic Model of Membrane Structure: Still relevant to understanding the structure, function and dynamics of biological membranes after more than 40 years.  Biochimica et Biophysica Acta 1838 (2014) 1451–1466.

http://www.sciencedirect.com/science/article/pii/S0005273613003933

Cholesterol in the Brain

In the past several years, studies have provided evidence that dysfunctional cholesterol metabolism in the brain may be involved in Huntington’s disease. Neurons themselves have low rates of cholesterol synthesis and they obtain most of their cholesterol from nearby cells called astrocytes (See figure below). The cholesterol needs to be shuttled to the neuron by ApoE containing lipoproteins. Without adequate cholesterol, proper myelin and new nerve connections cannot be formed during the learning process.  The role of cholesterol in the brain and in other brain conditions such as Alzheimer’s disease is just being studied in great detail.

The figure below was adapted from:  Marta Valenza and Elena Cattaneo, Emerging roles for cholesterol in Huntington’s disease, Trends in Neurosciences, September 2011, Vol. 34, No. 9, pages 474 – 486.

http://www.sciencedirect.com/science/article/pii/S0166223611000932

Brain Cholesterol Metabolism


Ancel Keys Book Cover 5-2014

When Ancel Keys discovered that high cholesterol concentrations in blood were associated with CHD in middle aged men, it highlighted the importance of this lipid that is actually in fairly low concentration within cells. It was known that cholesterol was a waxy substance but there was very little known about it except that it was the starting material for a group of steroid hormones, including estrogen and testosterone.

Little was known about the cholesterol in the blood until it was shown, by electrophoresis, to be carried by lipoproteins in blood. The lipoprotein families were finally isolated and characterized in the late 1940s using the newly developed ultracentrifuge (Gofman).

Gofman, J. W., Lindgren, F. T. & Elliot, H. (1949) Ultracentrifugal studies of lipoproteins of human serum. J. Biol. Chem. 179: 973–979.

http://www.jbc.org/content/179/2/973.full.pdf+html?sid=3464e673-7b4d-4ee7-b288-9d63bda6d824

The slide below shows that most cholesterol in blood is carried in Low Density Lipoprotein (LDL). High density lipoprotein (HDL) also carries cholesterol in blood, but much less than LDL does. We will discuss HDL later.

Cholesterol in blood

The following slide shows that Very Low Density Lipoprotein (VLDL) primarily delivers fatty acids to cells whereas LDL delivers cholesterol to cells. VLDL is secreted by the liver and exists in blood for several hours until most of the triacylglycerol molecules it carries are transferred to cells. About 50% of VLDL is converted to LDL, which mainly carries cholesteryl esters. LDL exists in blood for several days and it mainly delivers cholesterol to all cells except those in the brain, which LDL cannot enter due to the blood brain barrier.

VLDL and LDL in blood FN

Studies on the transport of fatty acids, cholesterol and lipoproteins using radioisotopes continued through the 1950s and 1960s (Fredrickson 1958), but there was still uncertainty about how lipoprotein particles interacted with cells.

Fredrickson, D. S. & Gordon, R. S. (1958) Transport of fatty acids. Physiol. Rev. 38: 585–630.

http://physrev.physiology.org/content/38/4/585.long

The mystery surrounding cholesterol and low density lipoprotein (LDL) persisted until two scientists unraveled the metabolism and function of LDL. Two new assistant professors, Joseph Goldstein and Michael Brown, at the University of Texas Southwestern Medical Center in Dallas, sought the metabolic reason for familial hypercholesterolemia (FH), a genetic disease where the concentration of cholesterol in blood is increased many fold over control, and where cholesterol deposits, called xanthomas, appear in the skin. These patients have heart attacks early in life, sometimes as early as six years old.

Drs. Goldstein and Brown cultured skin cells from patients who had the disease and compared cholesterol metabolism in them with its metabolism in fibroblasts from normal patients. They showed that adding LDL at very low concentrations to normal fibroblasts lowered the activity of a key enzyme in cholesterol synthesis, showing that LDL could affect cholesterol metabolism within cells.

FH fibroblasts did not react to treatment with LDL, so something was wrong with the ability of these cells to use LDL. Eventually, Drs. Goldstein and Brown determined that FH fibroblasts has a defective protein called the LDL receptor, which was involved in bringing LDL into cells. Cholesterol delivered to the cell with LDL is delivered to the cell using the LDL receptor and this cholesterol is capable of affecting (in this case, feedback regulating) cholesterol metabolism within the cell.

After purifying the LDL receptor, the laboratories of Drs. Goldstein and Brown went on to clone the gene for the LDL receptor, and show that the molecular defect in FH was a mutation in the LDL receptor protein. They later went on to show how the delivery of cholesterol to cells can modulate many pathways that control cholesterol metabolism in cells. This is shown on the fairly complex figure below.

LDL Receptor Scheme

The red writing within the cell diagram shows the major effects that occur in metabolism when LDL cholesterol is delivered to cells. First, the activity of HMG CoA reductase, an important regulatory enzyme in cholesterol synthesis, is decreased.  Second, cholesterol esterification is increased in order to store extra cholesterol in the cell’s lipid droplets. Third, the numbers of LDL receptors are decreased in order to slow the influx of cholesterol into the cell through the LDL receptor pathway.

The discovery of LDL receptors provided insights into how lipoproteins are taken up by cells and gave rise to the eventual discovery of many other receptors and complex receptor mediated uptake mechanisms used by all cells. For this major discovery, Drs. Goldstein and Brown won the Nobel Prize in Physiology or Medicine on October 15, 1985 (See their picture below).

Pic of Goldstein and Brown

In addition to discovering the LDL receptor, Drs. Goldstein and Brown would go on to make many more amazing discoveries in cholesterol and lipid metabolism. These additional discoveries include deciphering: 1) the complex mechanism of sterol receptor element binding proteins (SREBPs), proteins that direct the transcription of genes involved in both cholesterol and fatty acid metabolism, 2) the cholesterol sensor in the membrane of the endoplasmic reticulum, and 3) the transport of cholesterol throughout the cell. Additionally, Drs. Goldstein and Brown have made many contributions to the understanding of many human disease states that involve lipid metabolism, including several hyperlipidemias and type 2 diabetes. Many researchers in the lipid field strongly believe that Drs. Goldstein and Brown deserve to be awarded a second Nobel prize in medicine.

After the the Seven Countries study, Ancel Keys had accumulated three very large and significant accomplishments that highlight a remarkable scientific career. These accomplishments were:

  1. Formulating ready to eat meals (called K-rations) for the American armed forces during World War II
  2. Studying starvation with the purpose of learning the best procedures for treating starved individuals
  3. Conceiving and implementing the Seven Countries study that pointed to diet as being an important factor in the development of coronary heart disease (CHD) disease.

In the early 1950s Ancel Keys visited Rome to chair a conference on nutrition for the Food and Agriculture Organization. He heard from Professor Gino Bergami of the University of Naples that men in Naples, Italy were relatively free of CHD. He later visited the region, and established an office and lab, and learned that the men of Naples did, in fact, have less CHD than the men he studied in Minnesota. After observing similar protection against CHD in Madrid, Spain, Dr. Keys developed the hypothesis that it was the diet of these men that protected them from CHD. His later studies, including the Seven Countries study, convinced him that the Mediterranean diet was an important factor in maintaining health. With this knowledge, Dr. Keys and his wife, Margaret, a biochemist, wrote two very popular cook books that would help people eat healthy. These books were Eat Well and Stay Well (1959), and Eat Well and Stay Well the Mediterranean Way (1975). Both books were featured on the New York Times bestseller list. They wrote a third book, “The Benevolent Bean,” and it was also successful.

Interestingly, the success of these books allowed Dr. Keys and his wife to move to the town of Pollica, south of Naples, Italy, to live during their retirement and eat a Mediterranean diet up close and personal all year long.

The cook books that Ancel and Margaret Keys wrote were another major accomplishment In Dr. Keys’ career, because through these books millions of people improved their health by eating a Mediterranean Diet.

In 1995 Dr. Keys wrote an article where he related his thoughts about the Mediterranean diet in a special issue of the American Journal of Clinical Nutrition.  He defined the Mediterranean diet and emphasized the importance of different kinds of leaves in the diet, including “many kinds of lettuce, spinach, Swiss chard, purslane, and plants I cannot identify with an English name such as lettuga, barbabietole, scarola, and rape.” Dr. Keys noted (written in the 1990s) that the Mediterranean diet was changing in many regions such that more meat and milk was being consumed. After these observations, Dr. Keys started a series of clinical studies in Minnesota that studied how different fats affected blood cholesterol concentrations and these studies were published during the 1960s. Later when Ancel and Margaret traveled, they noted that Italian restaurants were steering father away from the Mediterranean diet they had first experienced in the 1950s.

In the last portion of his article in the AJCN, Dr. Keys was ahead of his time when suggested that healthy eating should be taught to school children. This is a suggestion that nutritionists are recommending today to battle the “Obesity Epidemic.” Certainly, the cookbooks he and his wife wrote disseminated the news about a healthy diet to millions of people throughout the world.

Keys A.  Mediterranean diet and public health: personal reflections.  Am J Clin Nutr. 1995 Jun;61(6 Suppl):1321S-1323S.

http://ajcn.nutrition.org.proxy.libraries.rutgers.edu/content/61/6/1321S.full.pdf+html

Ancel Keys followed the participants in the Seven Countries study for several 5 year follow-ups until he retired from the University of Minnesota in 1972. After retiring, Dr. Keys wrote his famous book, “Seven Countries,” which was published in 1980 by Harvard University Press.

In 1999, the 25 year follow-up of the Seven Countries study was published.

Alessandro Menotti, DaanKromhout, Henry Blackburn, FlaminioFidanza, RatkoBuzina & AulikkiNissinens for the Seven Countries Study Research Group. Food intake patterns and 25-year mortality from coronary heart disease: Cross-cultural correlations in the Seven Countries Study.  European Journal of Epidemiology 15: 507-515, 1999

http://www.jstor.org.proxy.libraries.rutgers.edu/stable/view/3581928

The 25-year CHD death rate in the men who were enrolled in the Seven Countries study was, as in the previous updates, highest in East Finland and lowest in Crete, Greece. The next highest death rates were in West Finland; Zutphen, The Netherlands; and the fourth highest was in the US. The next lowest death rates were the two cohorts from Japan. The full table is shown below.

25 year death rates from Seven Countries

The results from the analysis concerning food intake was succinctly described in the discussion of the paper:

“In fact, food patterns associated with high CHD mortality rates were characterized by high consumption of butter, dairy products and other animal products usually rich in saturated fatty acids and cholesterol. Food patterns associated with low or relatively low mortality rates from CHD were those characterized by high consumption of cereals, legumes, vegetable products, fish, oils and wine.“

The apparent negative effects of butter and dairy fats on CHD observed in the 25-year follow-up study are very similar to those presented in the Connor study discussed in the previous chapter.

The 40-year follow-up to the Seven Countries Study was published in 2007 and it is quite amazing that the participants in this study were in the age range 80 to 99 years old. Because the men were getting so old, they were starting to die of diseases associated with extreme aging. This is exemplified in the table of death rates shown below, where the total death rates from the cohorts were approaching the maximal rate. However, when the CHD data from the entire 40 years of the study were analyzed together (See figure 2 below), some interesting patterns were observed for some of the study cohorts. Serbia and Greece had upswings in their CHD death rates that mirrored the observations of Ancel and Margaret Keys that some countries were turning away from the Mediterranean diet because of an increase in their socio-economic status and a merging of rural and urban areas in some of the sub-industrialized countries. Finland and the USA tended to have lower rates further into the study as programs to lower fat intake took effect. The CHD rate in Japan remained consistently low. The 40 year follow-up accentuated the concept that changing the diet could both lower and increase CHD death rates depending upon the direction of the changes in the diet.

Alessandro Menotti, Mariapaola Lanti, Daan Kromhout, Henry Blackburn, Aulikki Nissinen, Anastasios Dontas, Antony Kafatos, Srecko Nedeljkovic, Hisashi Adachi. Forty-year coronary mortality trends and changes in major risk factors in the first 10 years of follow-up in the seven countries study. Eur J Epidemiol (2007) 22:747–754.

Click to access art%253A10.1007%252Fs10654-007-9176-4.pdf

Table 1 - 40 yr CHD death rates

Change in CHD death rates over 40 yrs


« Newer Posts - Older Posts »

Categories